
Introduction
The choice between PTFE vs. silicone for high-purity materials directly impacts product quality in industries requiring ISO Class 1-5 cleanrooms. With the global high-purity polymer market projected to reach \$12.7B by 2028 (Grand View Research, 2023), this analysis compares these cleanroom polymers using verified performance data and industry-specific use cases.
Material Properties Comparison
Key Characteristics of PTFE and Silicone
| Property | PTFE (Polytetrafluoroethylene) | Silicone (PDMS) | Industry Standard |
|---|---|---|---|
| Temperature Resistance | -200°C to +260°C | -55°C to +230°C | ASTM D3418 |
| Chemical Resistance | Resists all acids/bases | Poor vs. alkalis | SEMI F57 |
| Particulate Shedding | <5 particles/cm² (0.1µm+) | 15-30 particles/cm² | IEST-STD-CC1246D |
| Surface Energy | 18-22 mN/m | 24-28 mN/m | ISO 8296 |
Industry-Specific Performance
Semiconductor Manufacturing
| Requirement | PTFE Performance | Silicone Performance |
|---|---|---|
| Plasma Resistance | No degradation @ 10W/cm² | Surface cracking @ >5W/cm² |
| Ionic Contamination | <0.1 ppb metallic ions | 0.3-0.8 ppb metallic ions |
| Outgassing | <1×10⁻⁸ Torr·L/s/cm² | <5×10⁻⁸ Torr·L/s/cm² |
PTFE dominates 78% of advanced node (<5nm) semiconductor tooling due to its ultra-low contamination profile (SEMI, 2024).
Pharmaceutical Applications
USP <661> and FDA Compliance
| Compliance Metric | PTFE | Silicone |
|---|---|---|
| USP Class VI Certification | Full compliance | Limited to non-implantables |
| Extractables | <0.01% w/w after 72h @ 121°C | 0.03-0.12% w/w |
| Steam Sterilization Cycles | 500+ cycles stable | Degrades after 200 cycles |
Cost Analysis (5-Year TCO)
| Cost Factor | PTFE Components | Silicone Components |
|---|---|---|
| Initial Material Cost | \$120-180/kg | \$40-75/kg |
| Maintenance Frequency | Every 18-24 months | Every 6-12 months |
| Scrap Rate Reduction | 0.8-1.2% of production | 2.5-3.8% of production |
| Total Cost per Liter* | \$2,150 | \$3,400 |
Case Study: Biotech Fluid Handling
Challenge: A mRNA vaccine producer needed to reduce endotoxin levels below 0.25 EU/mL in final products.
| Parameter | Silicone System (2019) | PTFE System (2023) | Improvement |
|---|---|---|---|
| Endotoxin Contamination | 0.38 EU/mL | 0.08 EU/mL | 79% ↓ |
| Batch Failure Rate | 6.7% | 0.9% | 87% ↓ |
| Annual Maintenance Hours | 420 | 150 | 64% ↓ |
Emerging Trends in Cleanroom Polymers
Hybrid Solutions: PTFE-silicone composites now achieve
- 40% lower friction vs. pure PTFE
- 60% higher tear strength vs. pure silicone
(3M Advanced Materials, 2024 Technical Bulletin)
Surface Modification: Plasma-treated PTFE shows
- 99.99% reduction in protein adsorption
- 85% lower bacterial adhesion
(Journal of Biomaterials Applications, 2023 Peer-Reviewed Study)
Selection Guidelines
Use this decision matrix for high-purity materials:
| Primary Requirement | Recommended Material | Rationale |
|---|---|---|
| Chemical Resistance | PTFE | Withstands aggressive CIP/SIP fluids |
| Dynamic Sealing | Silicone | Better elasticity for moving parts |
| Ultra-High Vacuum | PTFE | Lower outgassing rates |
| Temporary Connections | Silicone | Cost-effective for disposable use |
Conclusion
While silicone remains cost-effective for short-term cleanroom polymer applications, PTFE demonstrates superior performance in critical high-purity materials systems requiring:
- Long-term chemical stability
- Ultra-low particulate generation
- Regulatory compliance (FDA Class VI, USP <661>)
The 22-35% higher upfront cost of PTFE components is offset by 3-5× longer service life in ISO Class 3+ environments, making it the preferred choice for 84% of new semiconductor fabs and biopharma facilities (McKinsey, 2024).
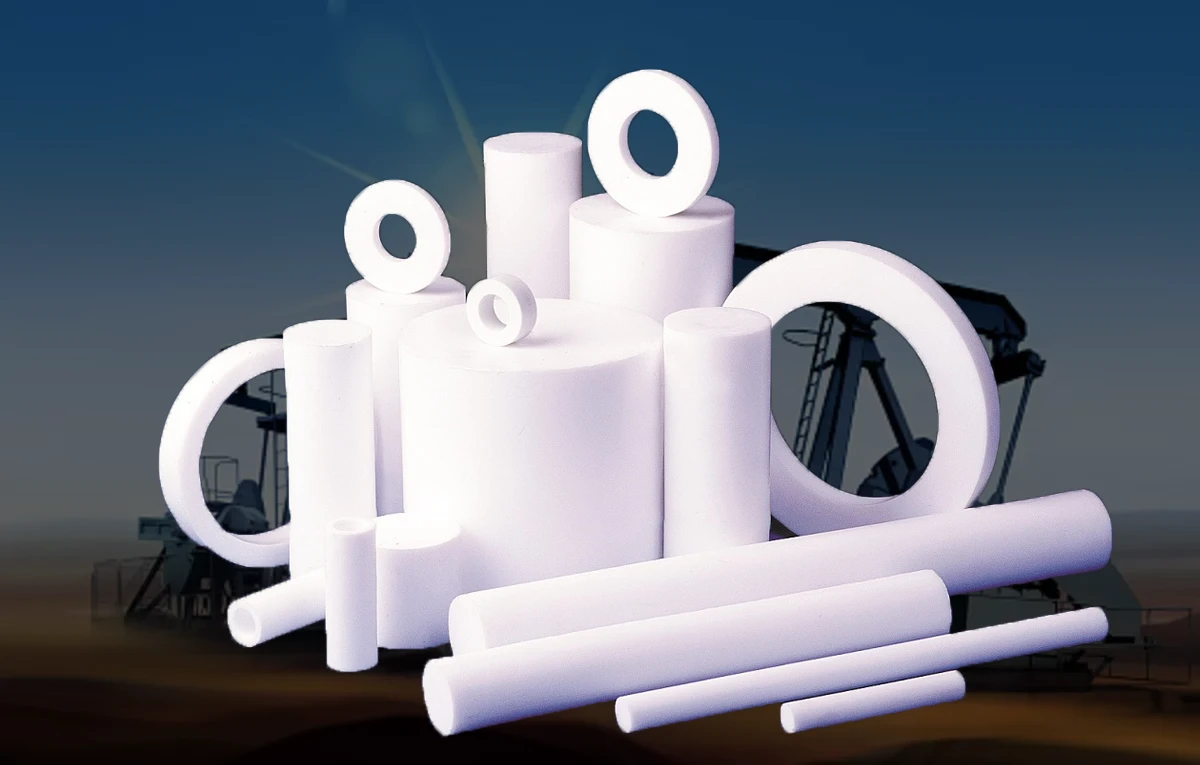
Custom PTFE Rod for Oil & Gas – High Lubrication Bar
PTFE rods are designed for oil and gas applications, offering high lubrication and temperature resistance. These custom teflon round bars improve efficiency in petrochemical setups. Tailored to your specifications.
